Data acquisition and visualization through embodied sensors

Course Pre-Master (DASU20)

Data Visualization / Ethical Considerations / Motivational App

Figuring out how to present information through data visualization was a key part of my vision.   

Year

2023

Expertise

User and Society
Creativity and Aesthetics
Math, Data and Computing

See Final Report

Institution

Technical University Eindhoven

Team

Roos Ezendam
Tessa van Maanen
Giovanni Sapienza

During the pre-master period, I worked on shaping my views about design and its impact on society, especially in the context of education. Figuring out how to present information through data visualization was a key part of my vision. 

The Data Acquisition and Visualization course was a good starting point for me to get into data and programming. These skills were part of my learning goal to work on my deficiency in Math, Data, and Computing. One thing that stood out in the lectures was the story of two women getting to know each other by sharing data for a year. It made me realize that data isn’t just about numbers; it’s what is happening all around us. This made me more interested in exploring the subject. 

This course taught me the basics of Jupyter and Python, which I used in my squad project with G. Sapienza.  Studying in this course involved more than just coding – it required me to look at data critically and think about the best way to present the information. Dealing with program issues could be frustrating, but when I finally saw my visualizations, it was encouraging. 

However, there were limits during the course, especially with my coding skills and the given datasets. Despite these challenges, I think I’ve improved in programming, and I plan to bring data visualization into future projects and find ways to collect my own data. 

Thinking about the ethics of using data was an important part of this course. The rules, both ethical and lawful, on how apps need to handle user data were interesting to learn about. This added depth to how I see the impact of using data in design. 

In conclusion, while I’ve learned a lot about design, data, and programming, I know there’s more to explore. I want to keep developing my skills, use data visualization in my projects as I think it enhances playful learning, and keep thinking about the ethical side of design and data to adhere to the ethics of data handling. This journey has convinced me to stay curious and keep integrating these elements into my evolving design practice. 

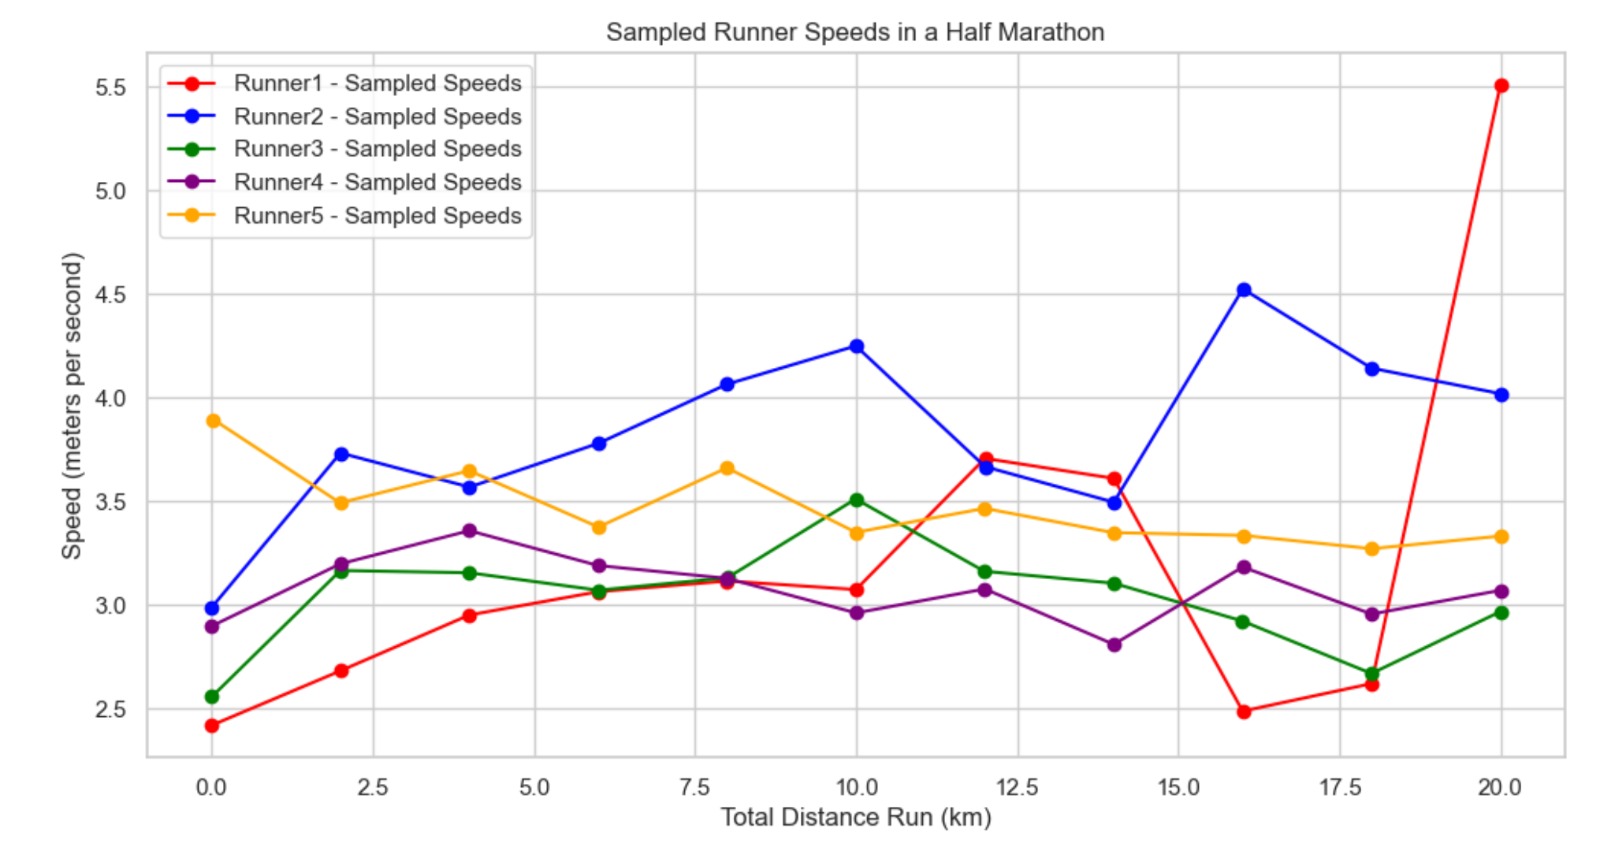
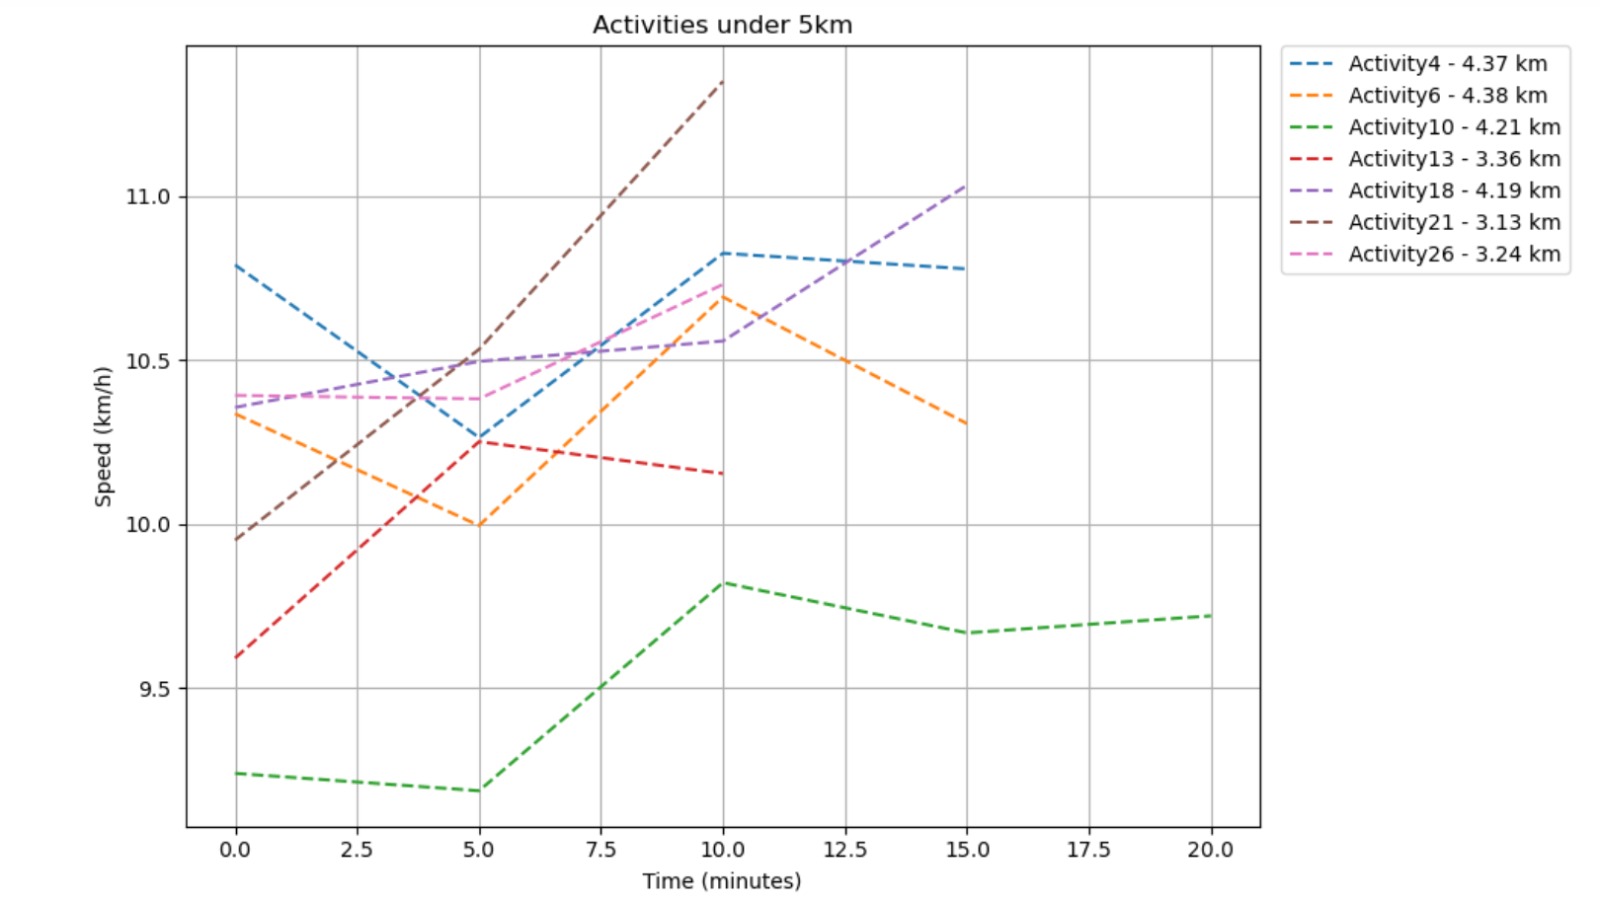
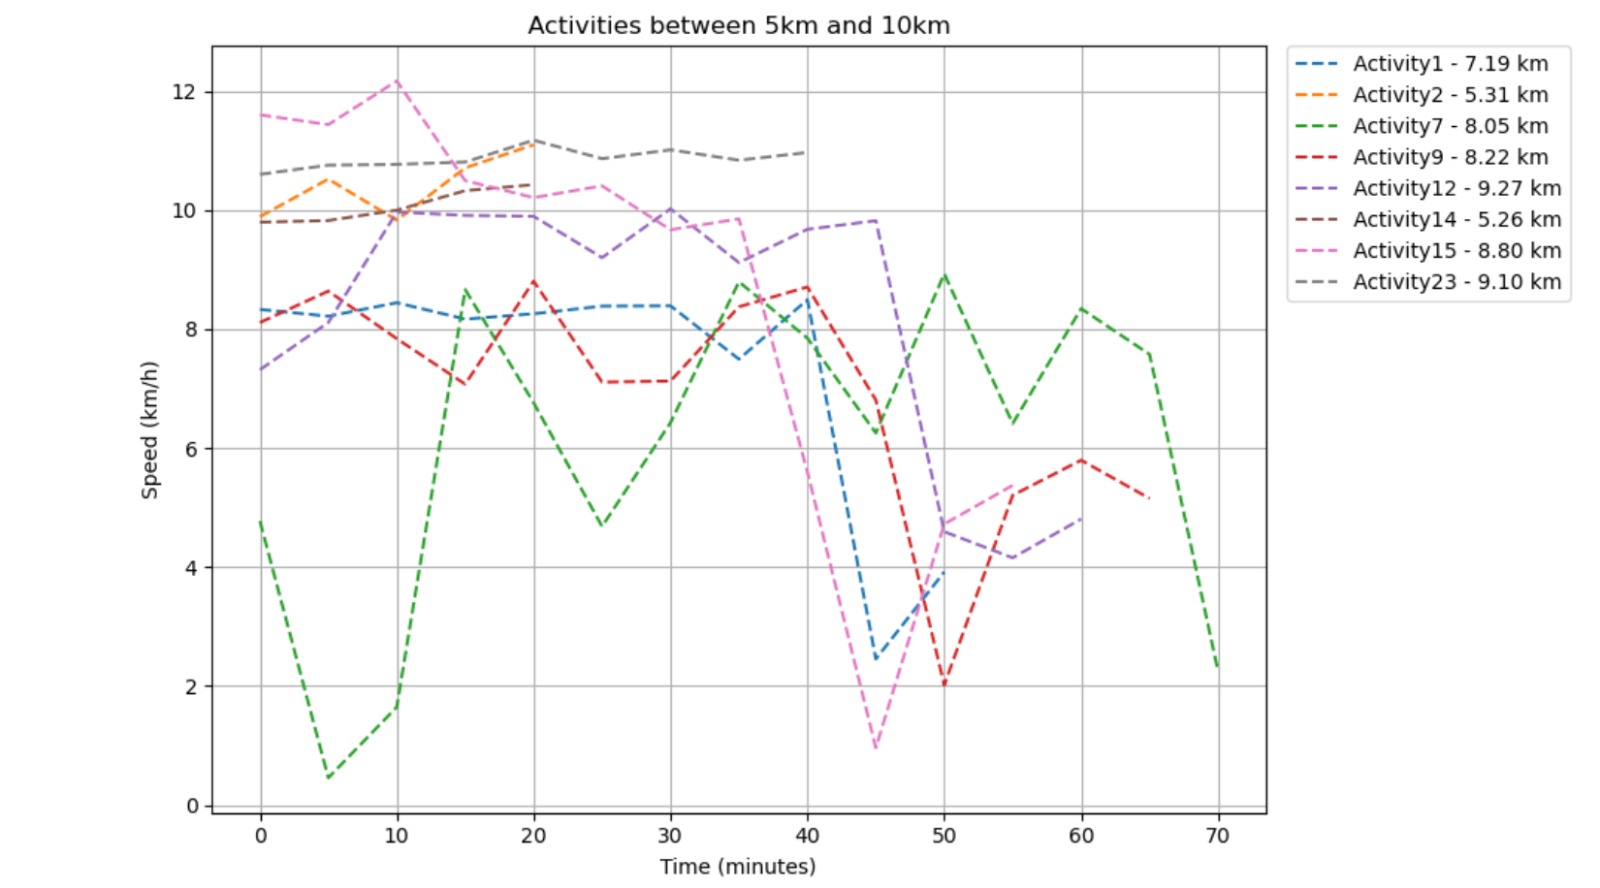
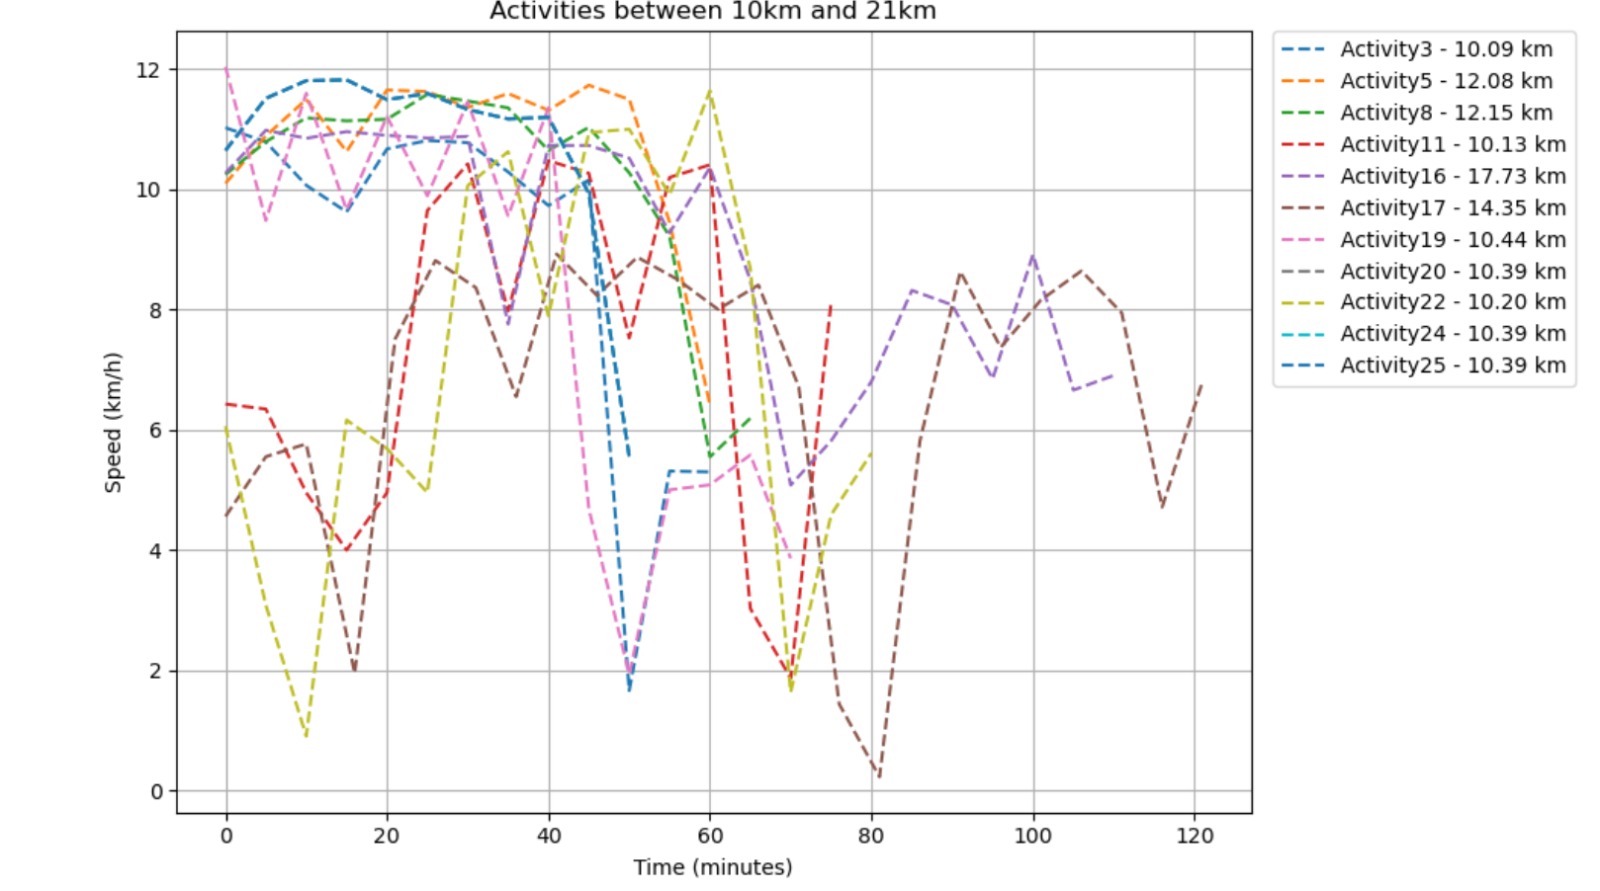
Data visualizations made with Jupyter Notebook:
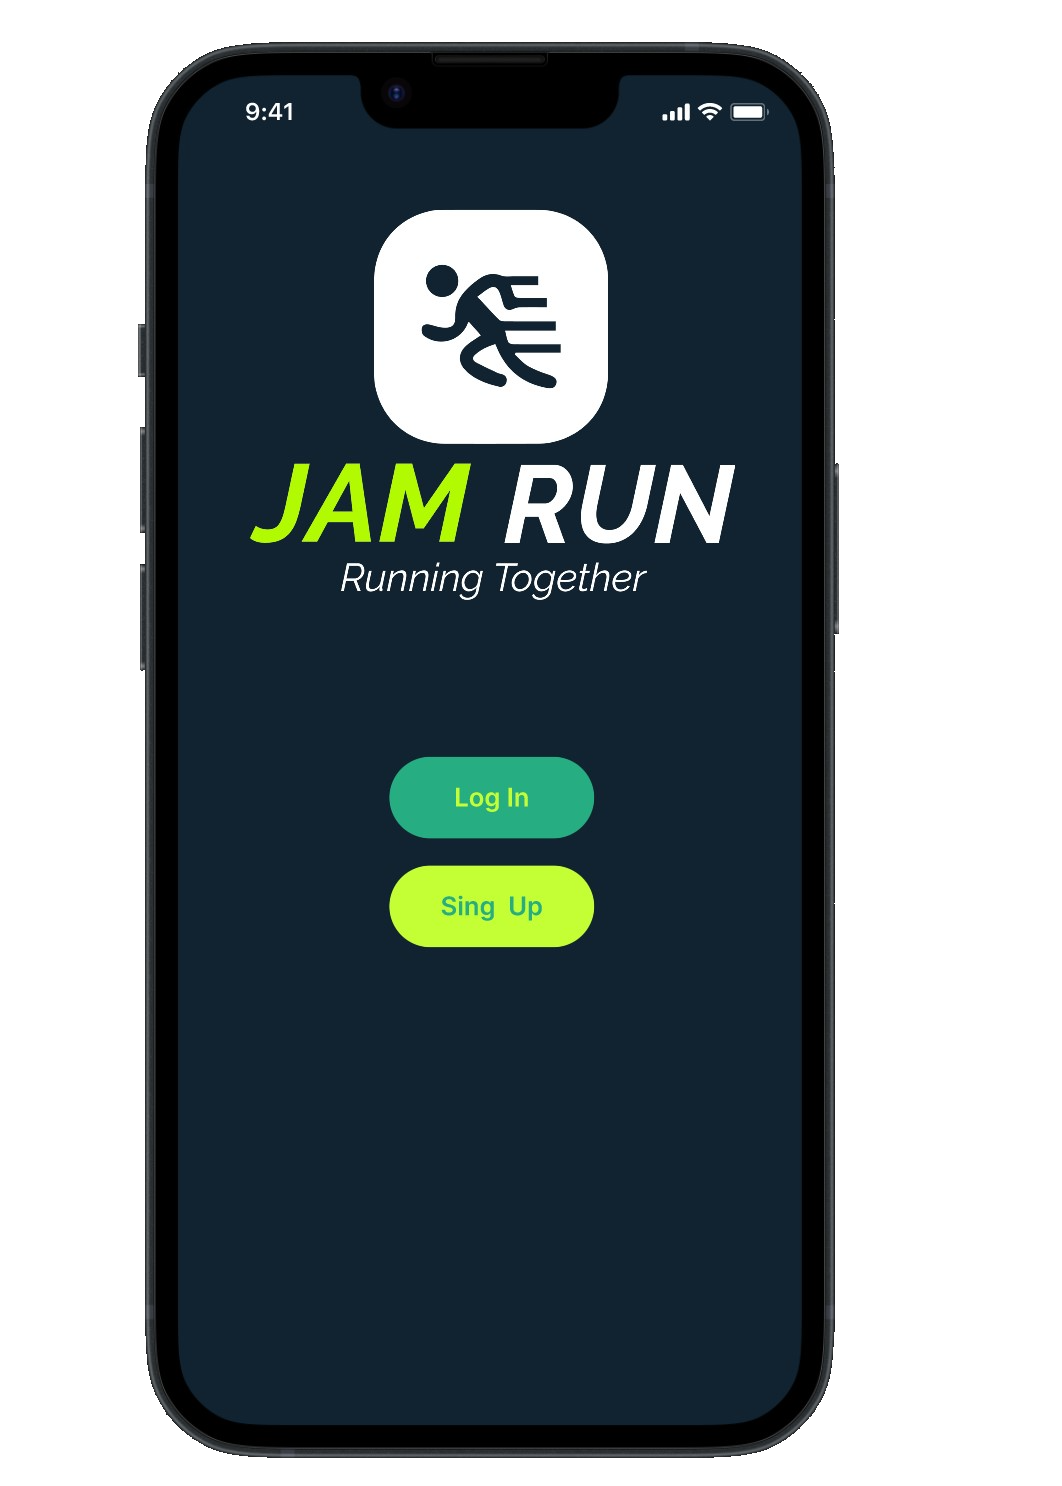
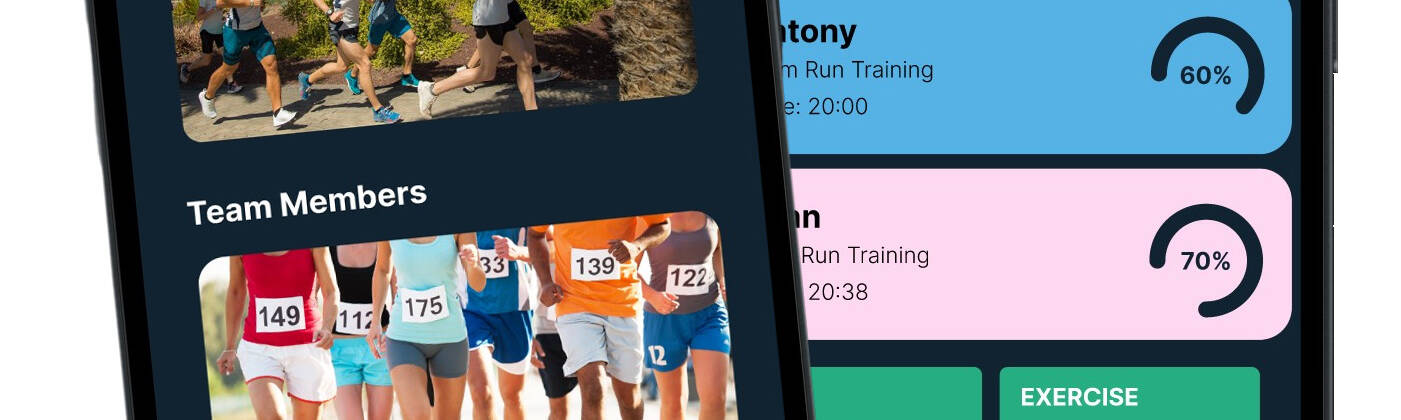
JAM Run

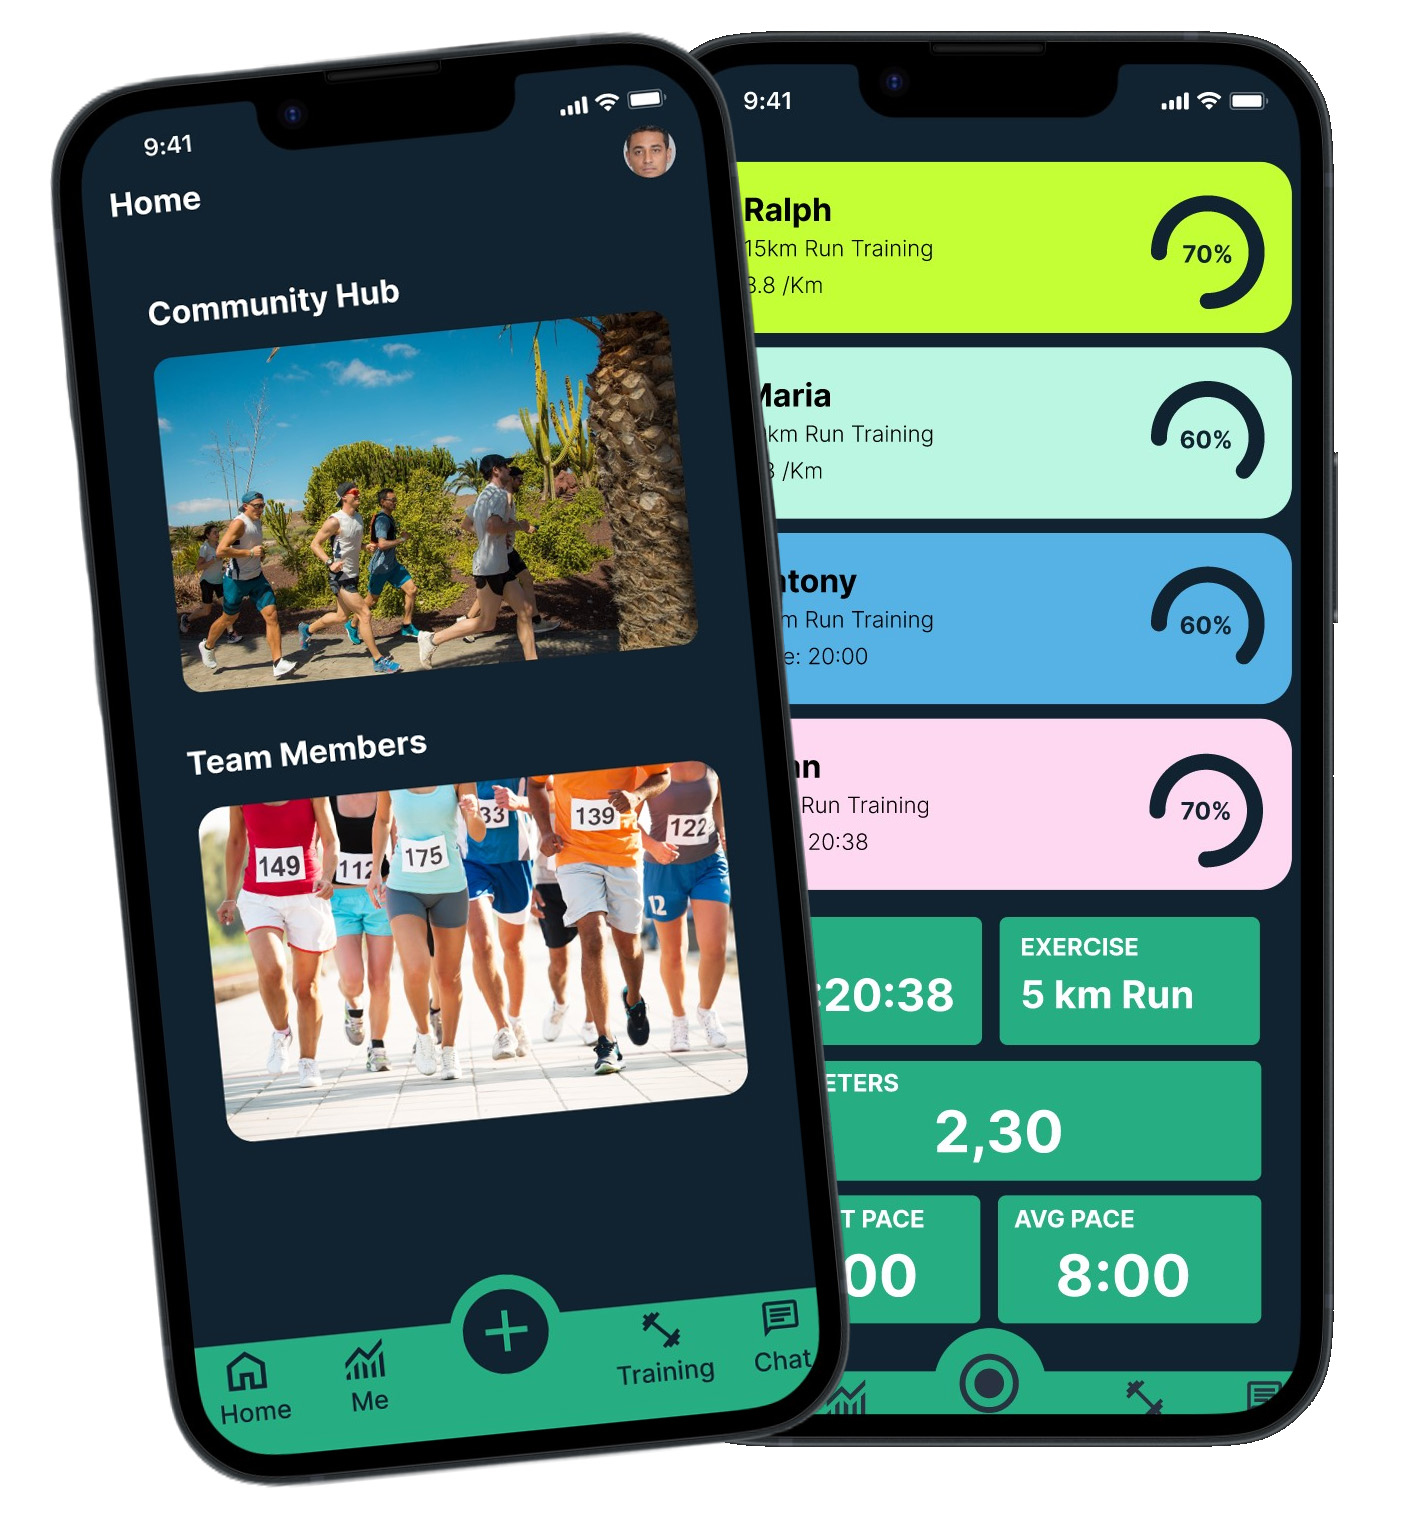
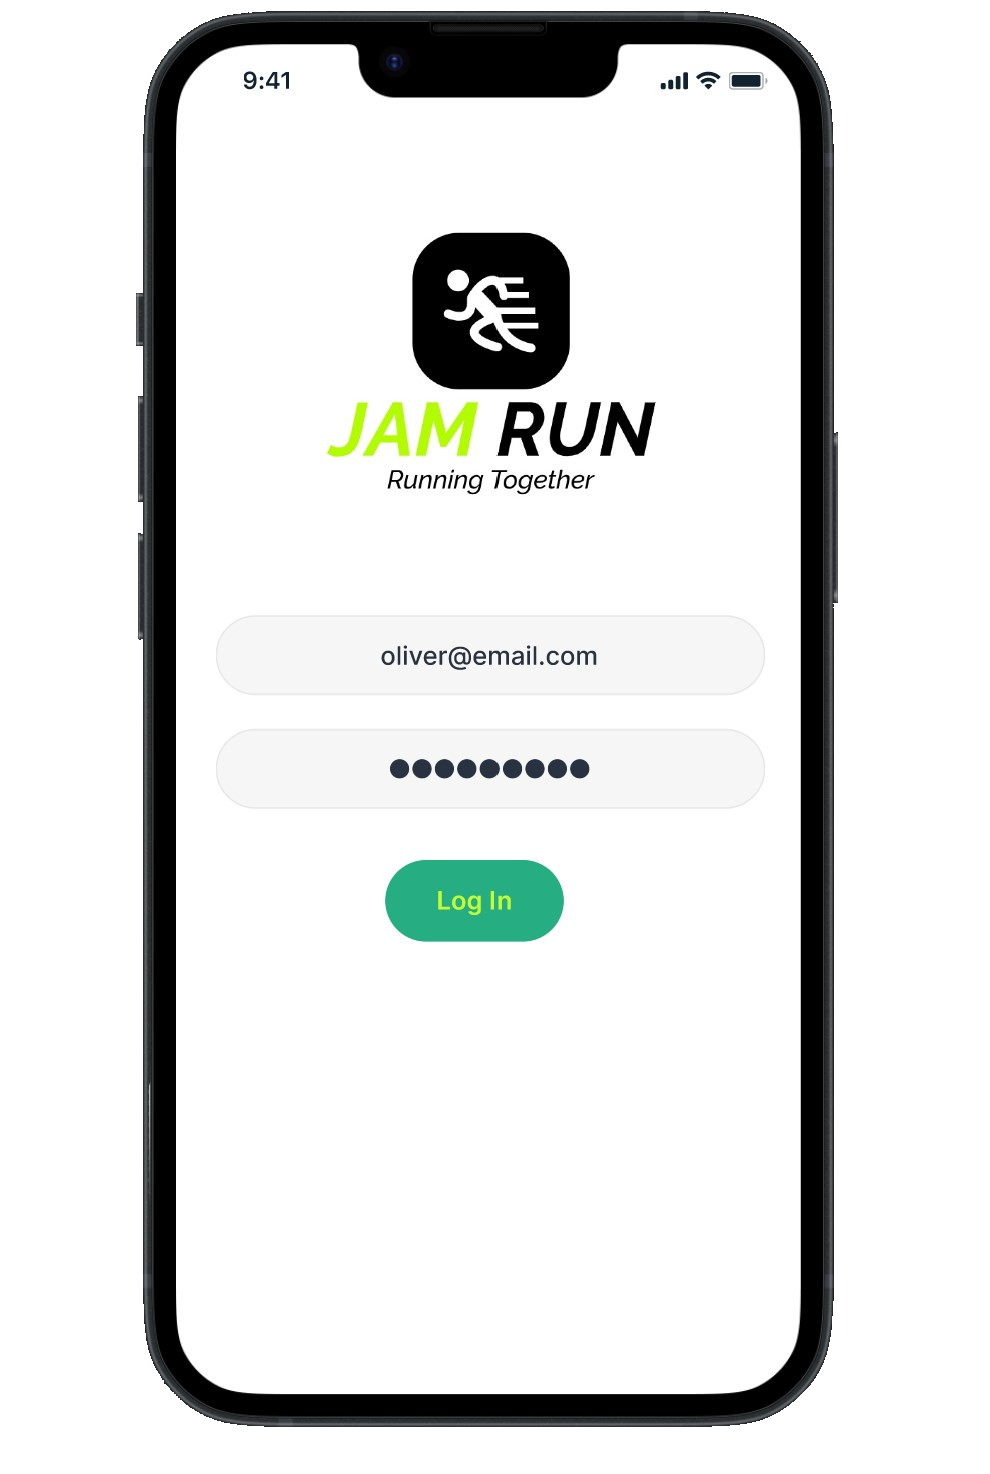
JAM RUN caters to runner team performance, requiring users to sign up collectively rather than individually. Each team is assigned a dedicated account, where various individual profiles are interconnected. To access the team account, every runner is provided with an unique username and password. 

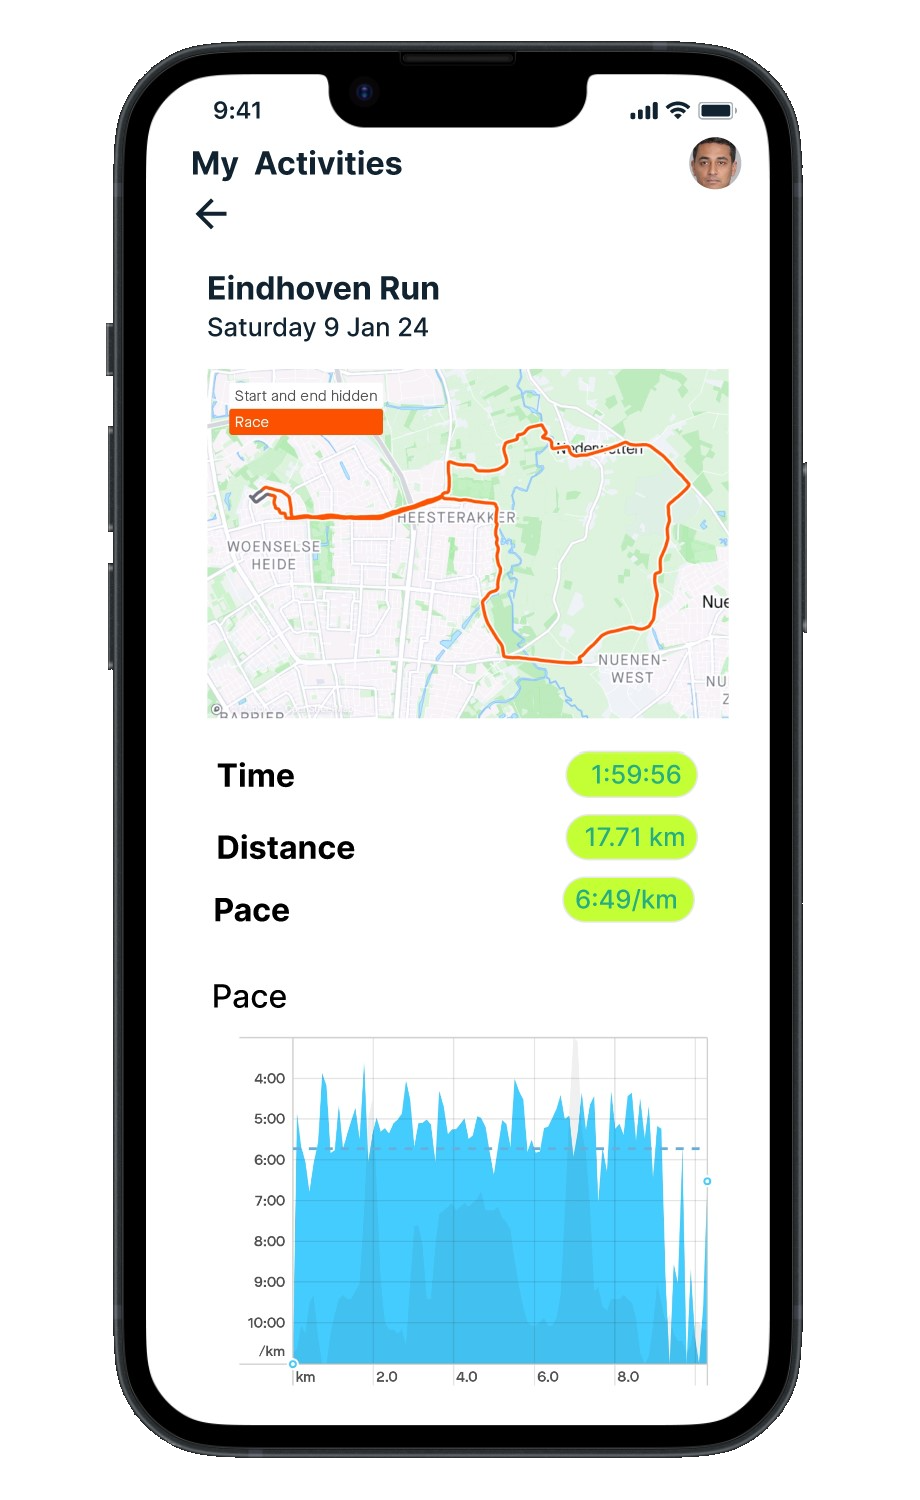
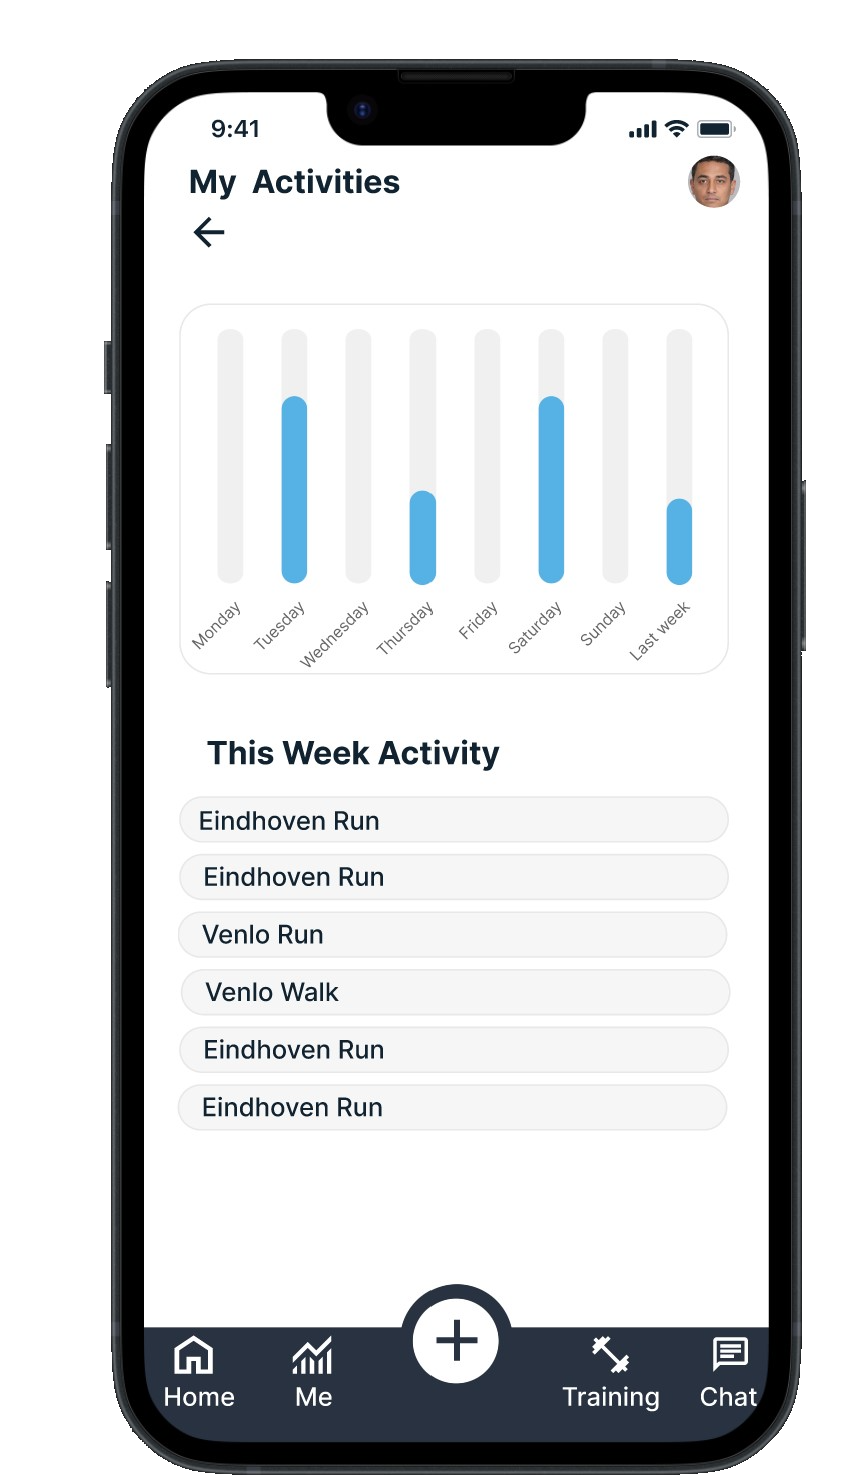
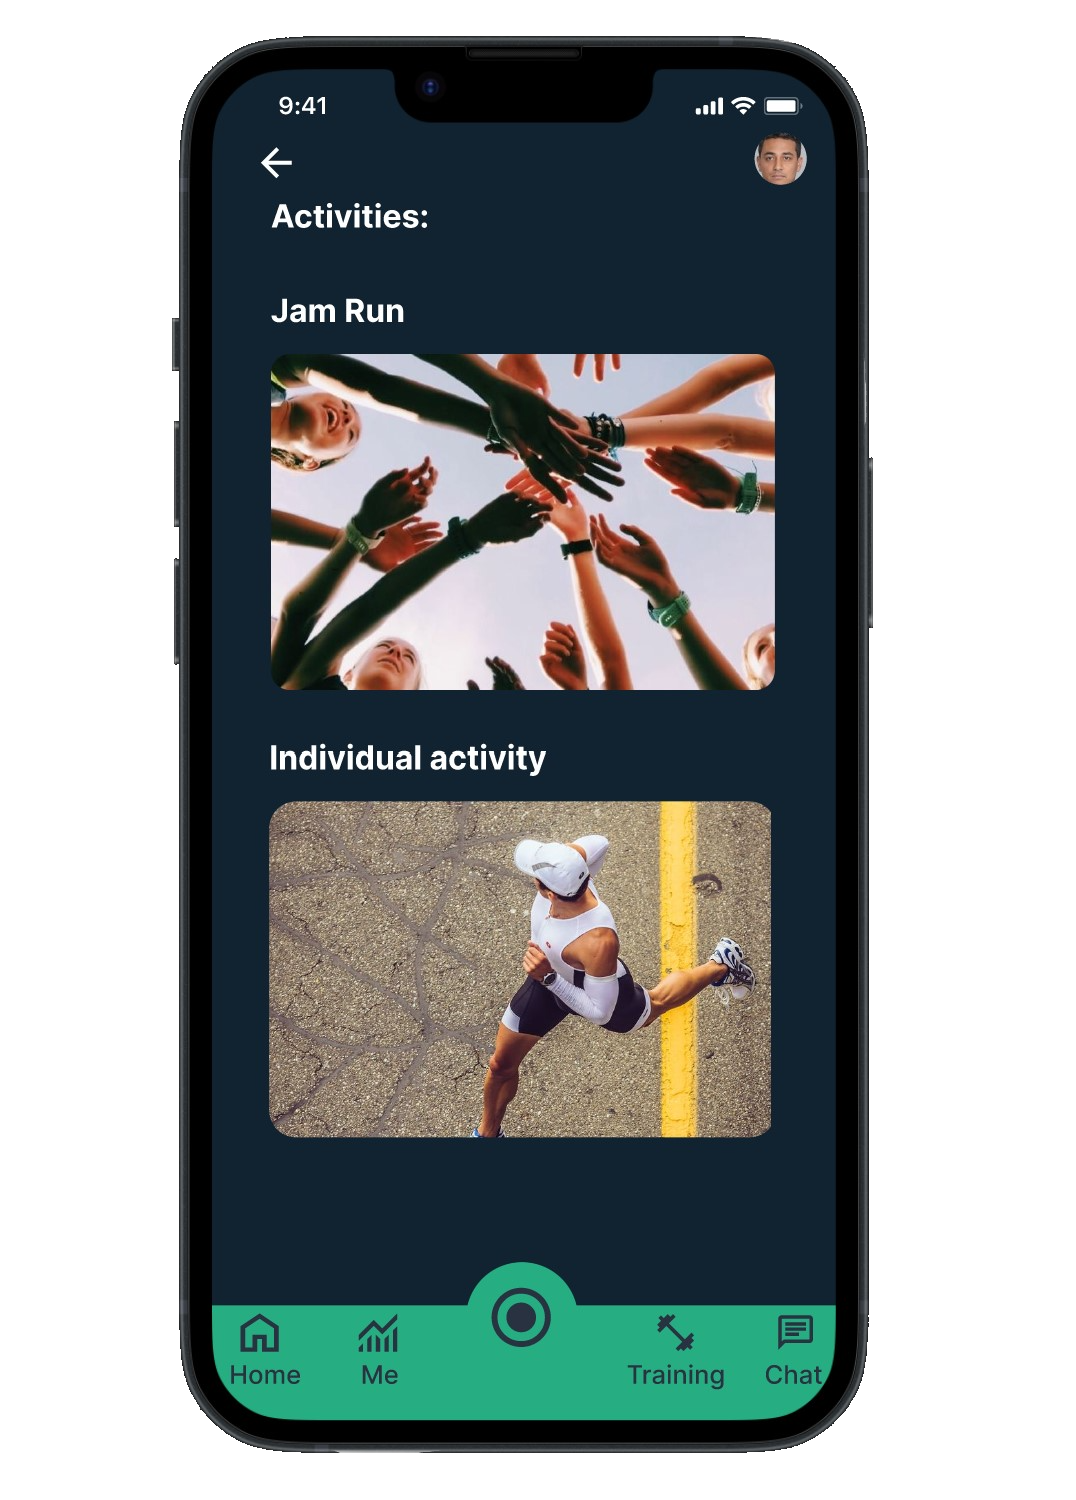
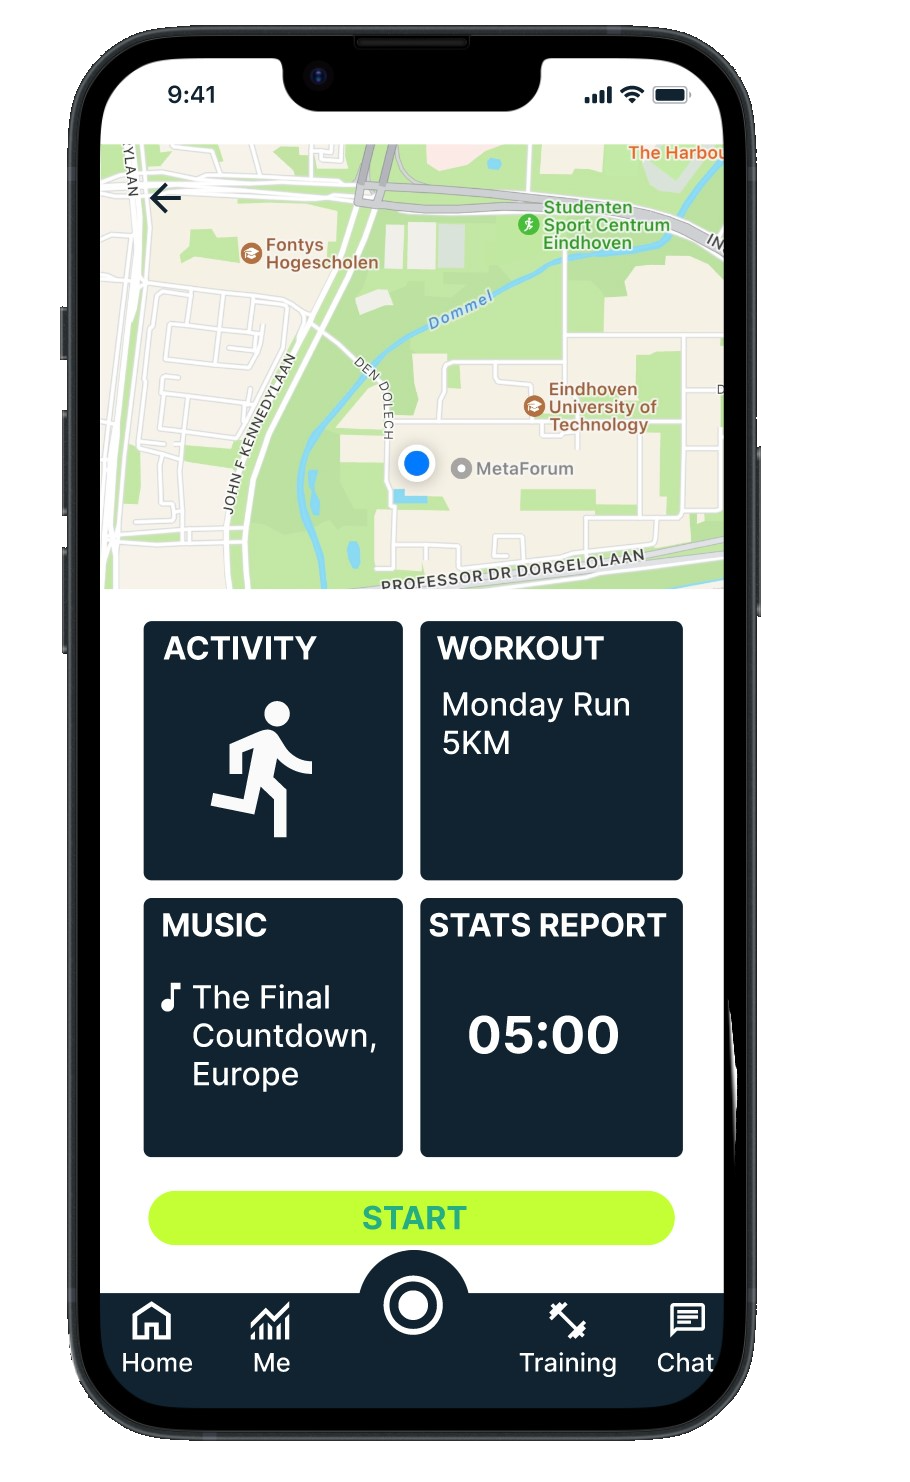
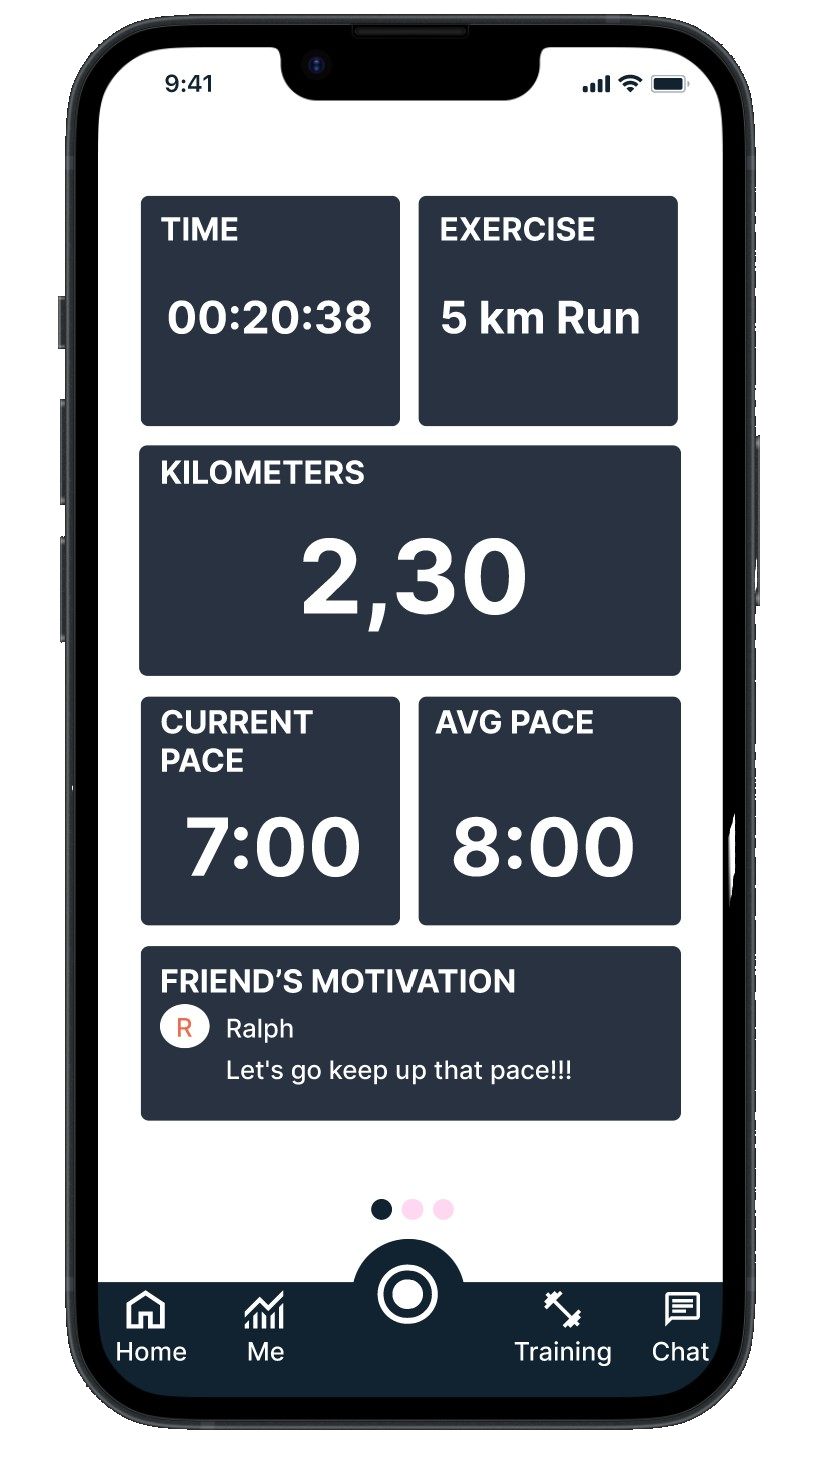
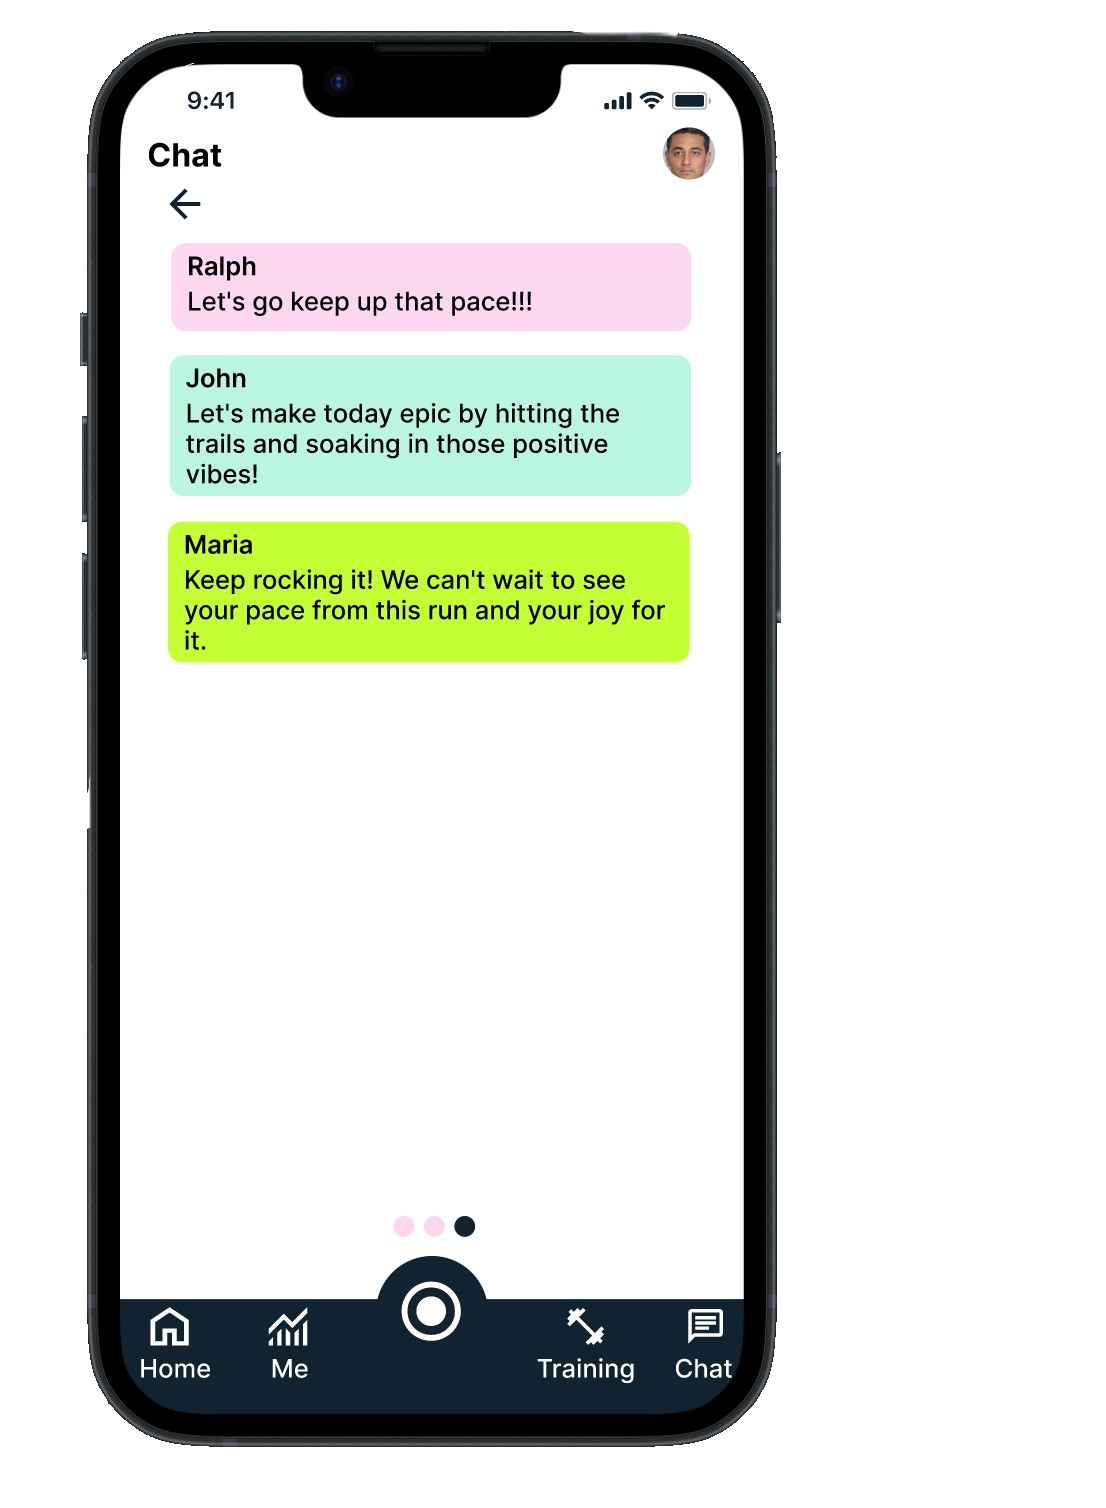
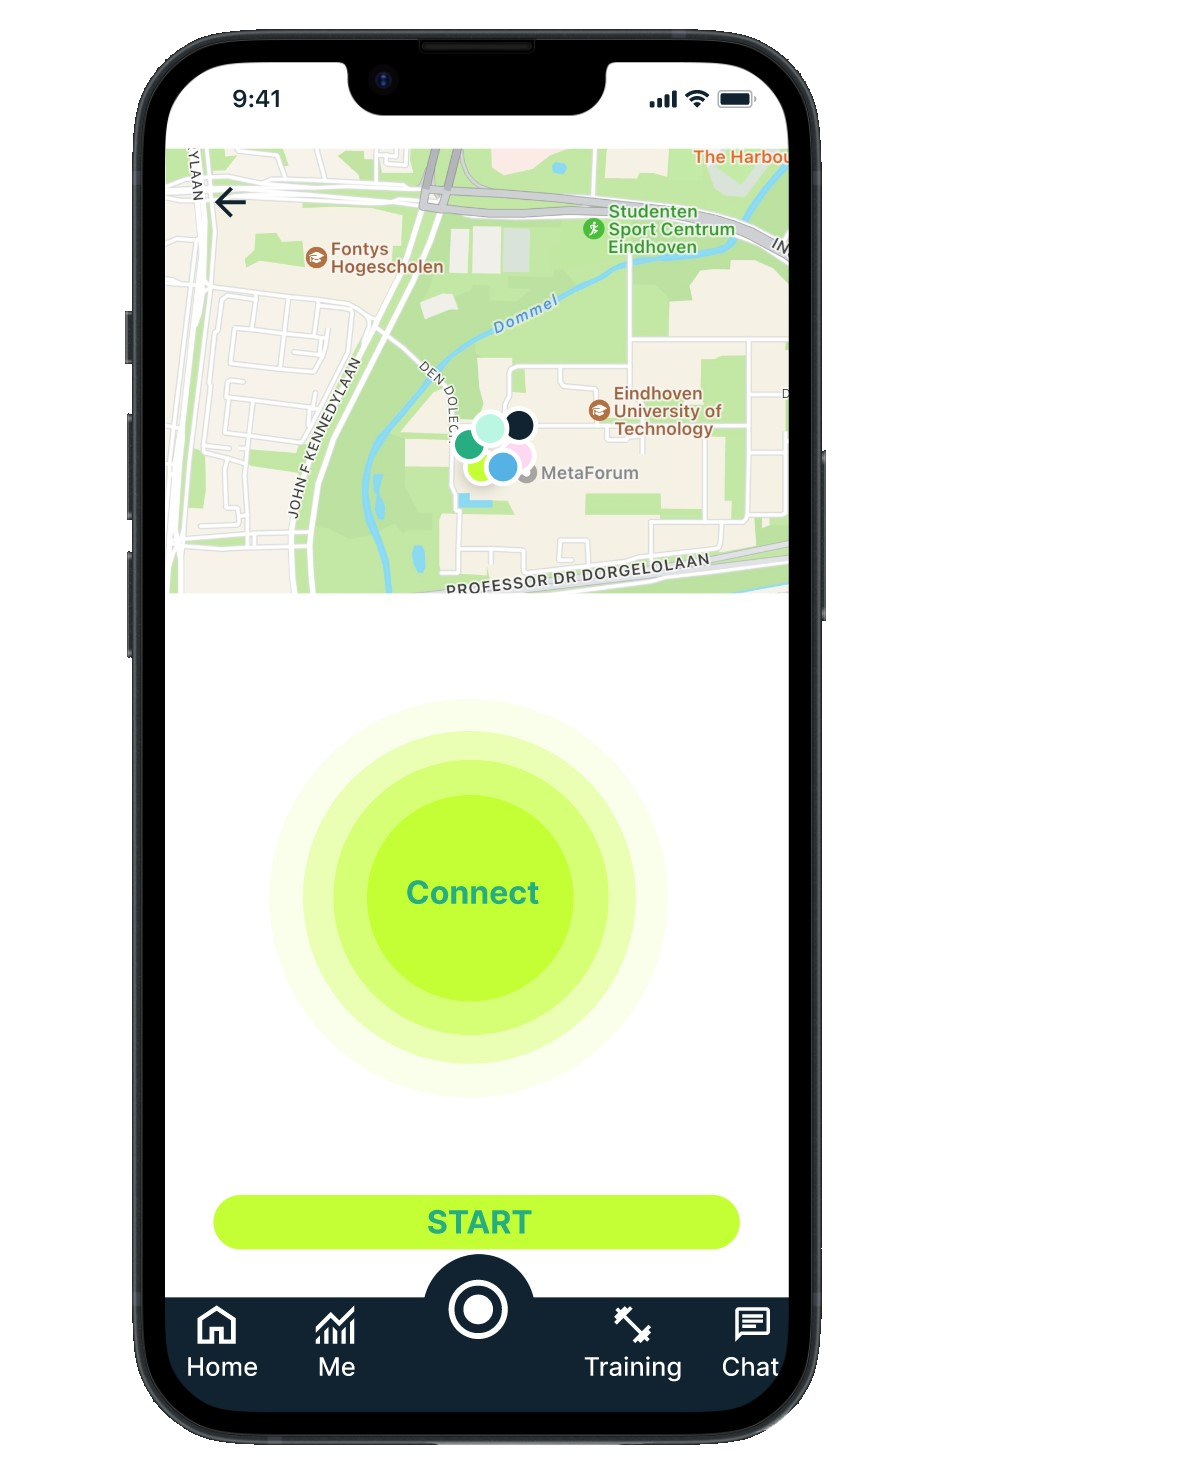
The standout feature of JAM RUN lies in the collaborative effort of team members to achieve their running goals together. While individual training sessions are an option, the app emphasizes on the motivational aspect of teamwork. Upon initiating an activity, teammates receive push notifications regarding the progress of the user and its team members, enabling them to send encouraging messages during your run to increase motivation of the runner. 

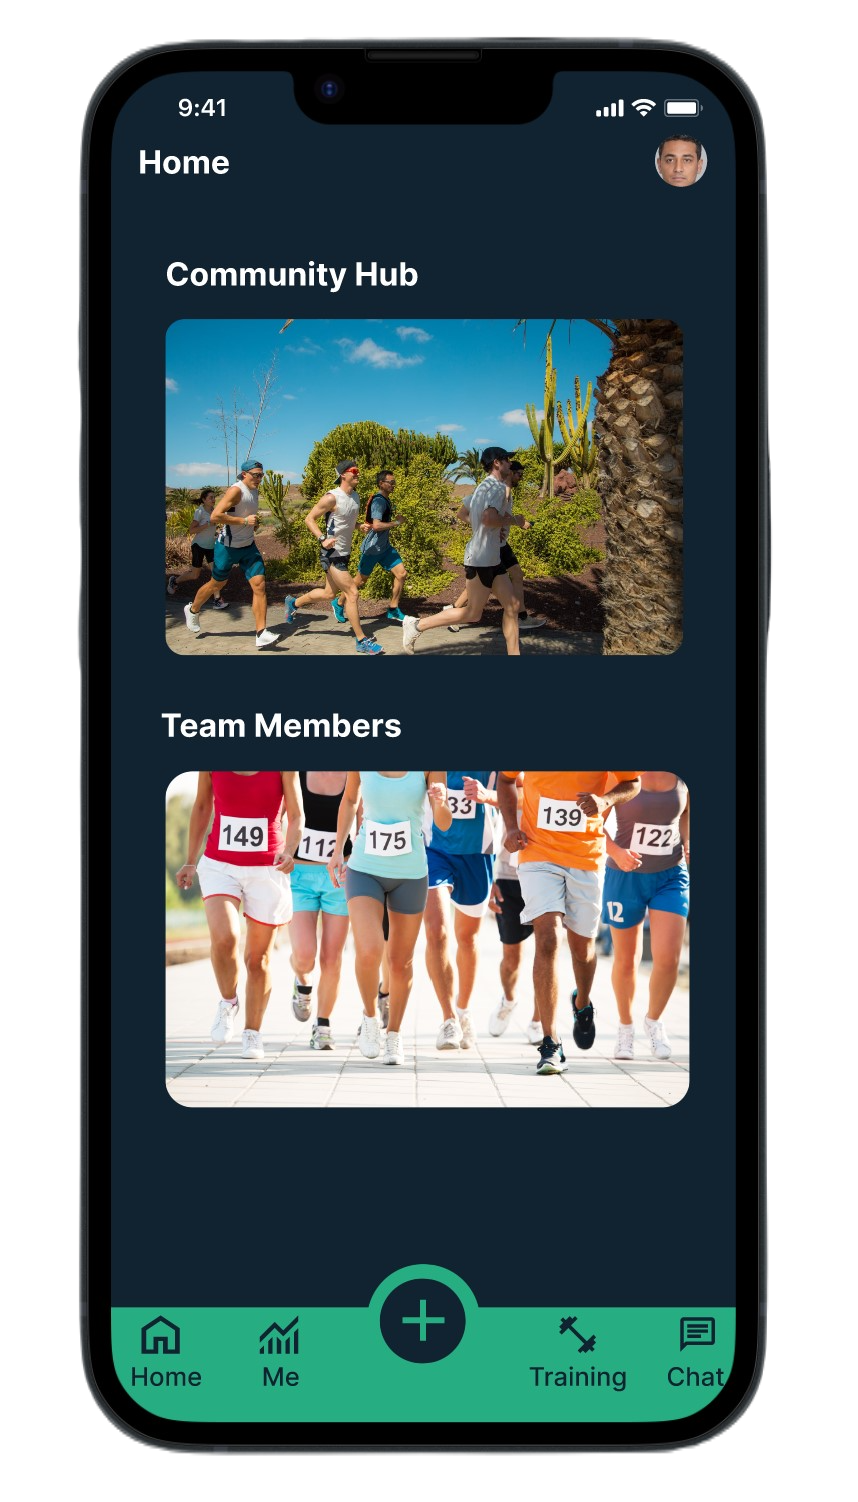
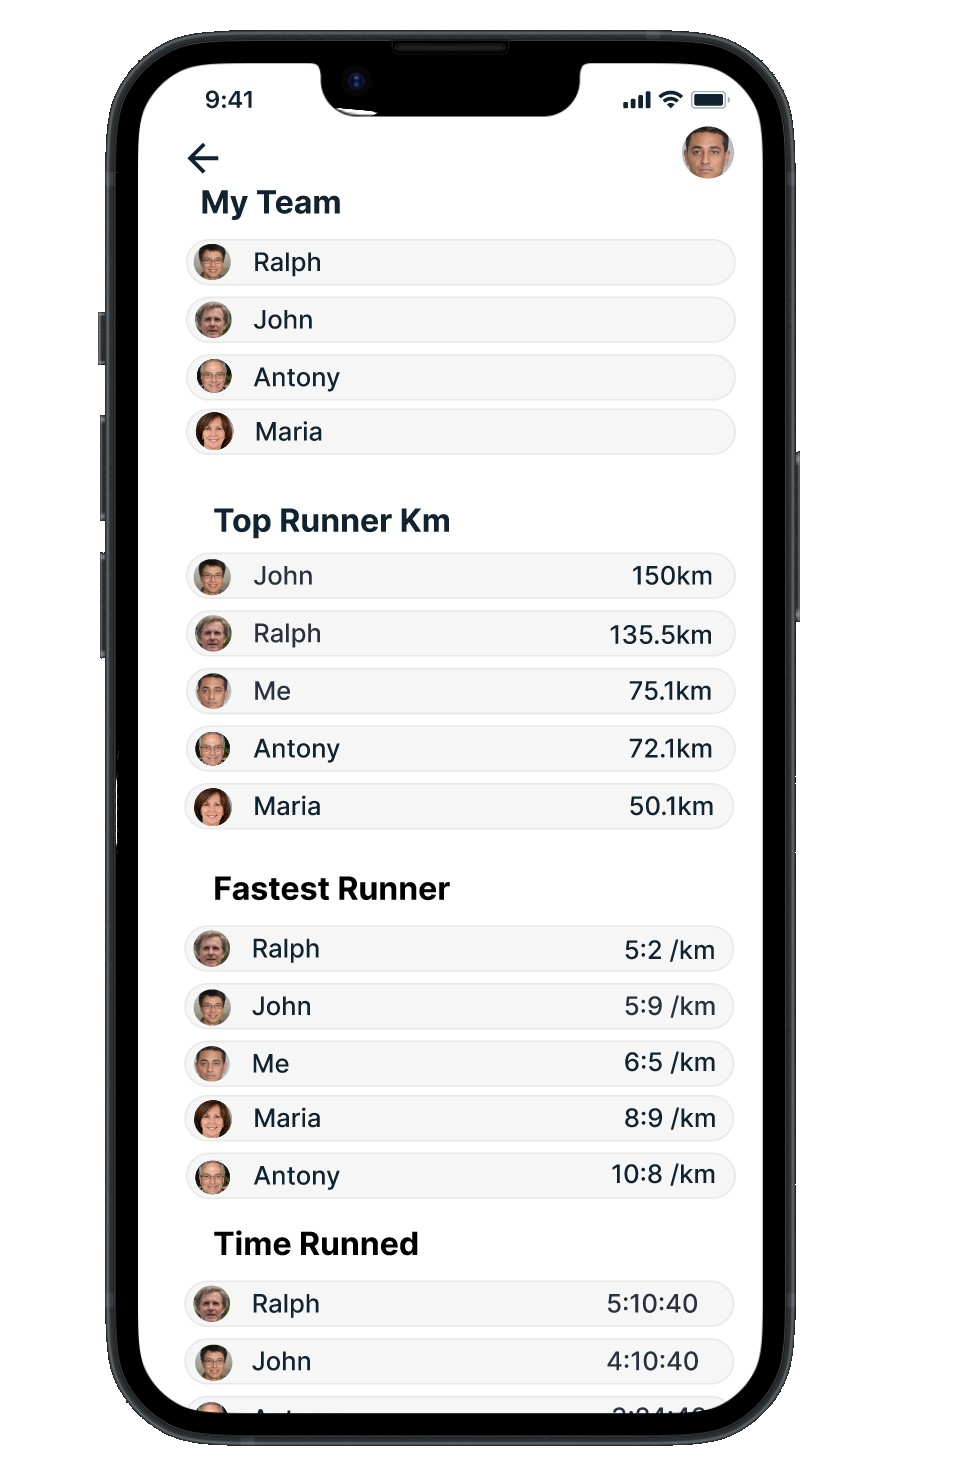
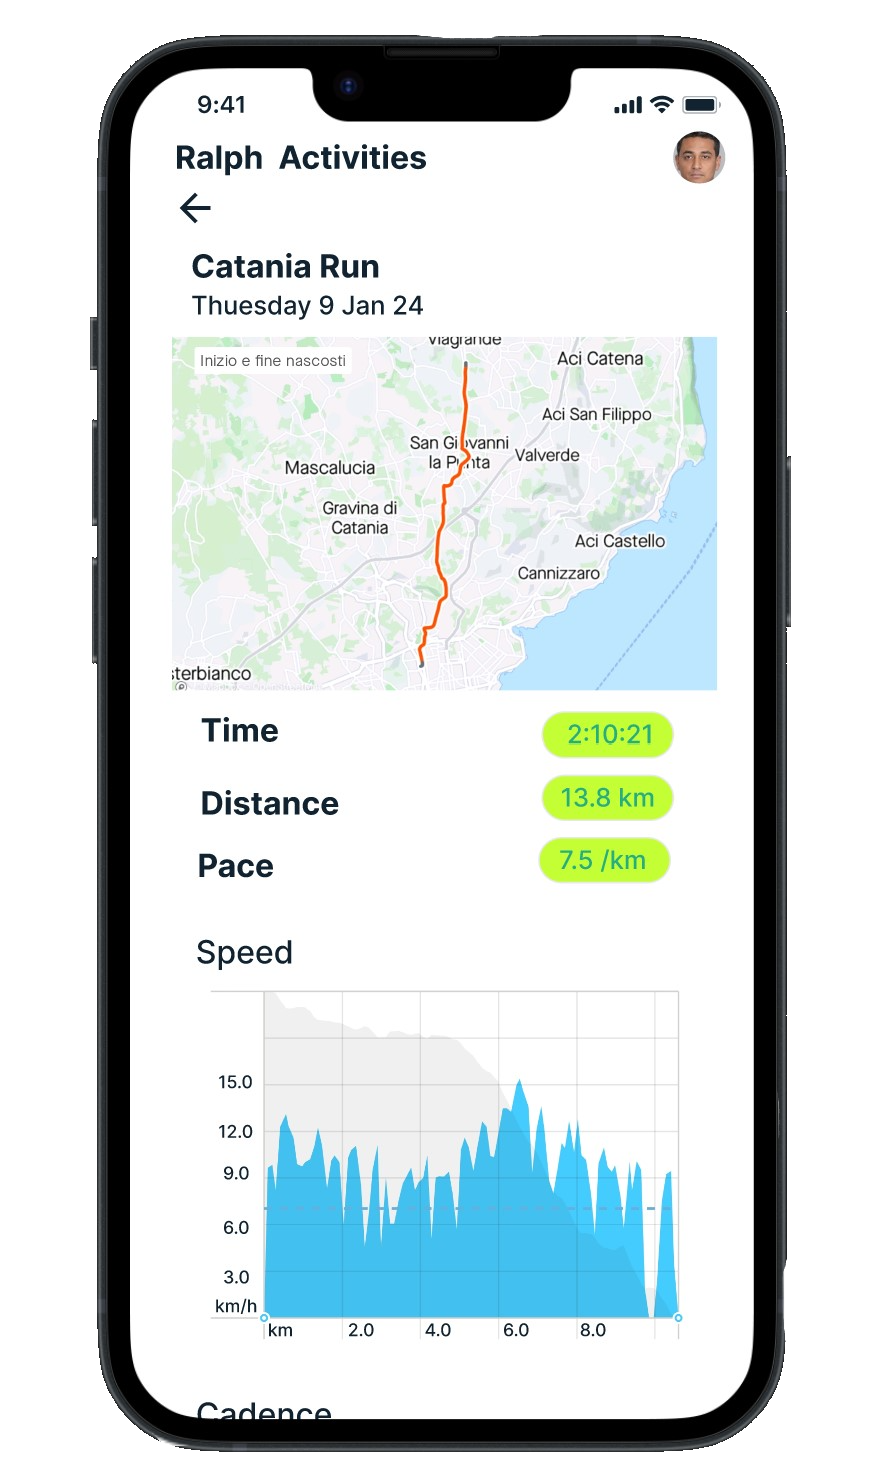
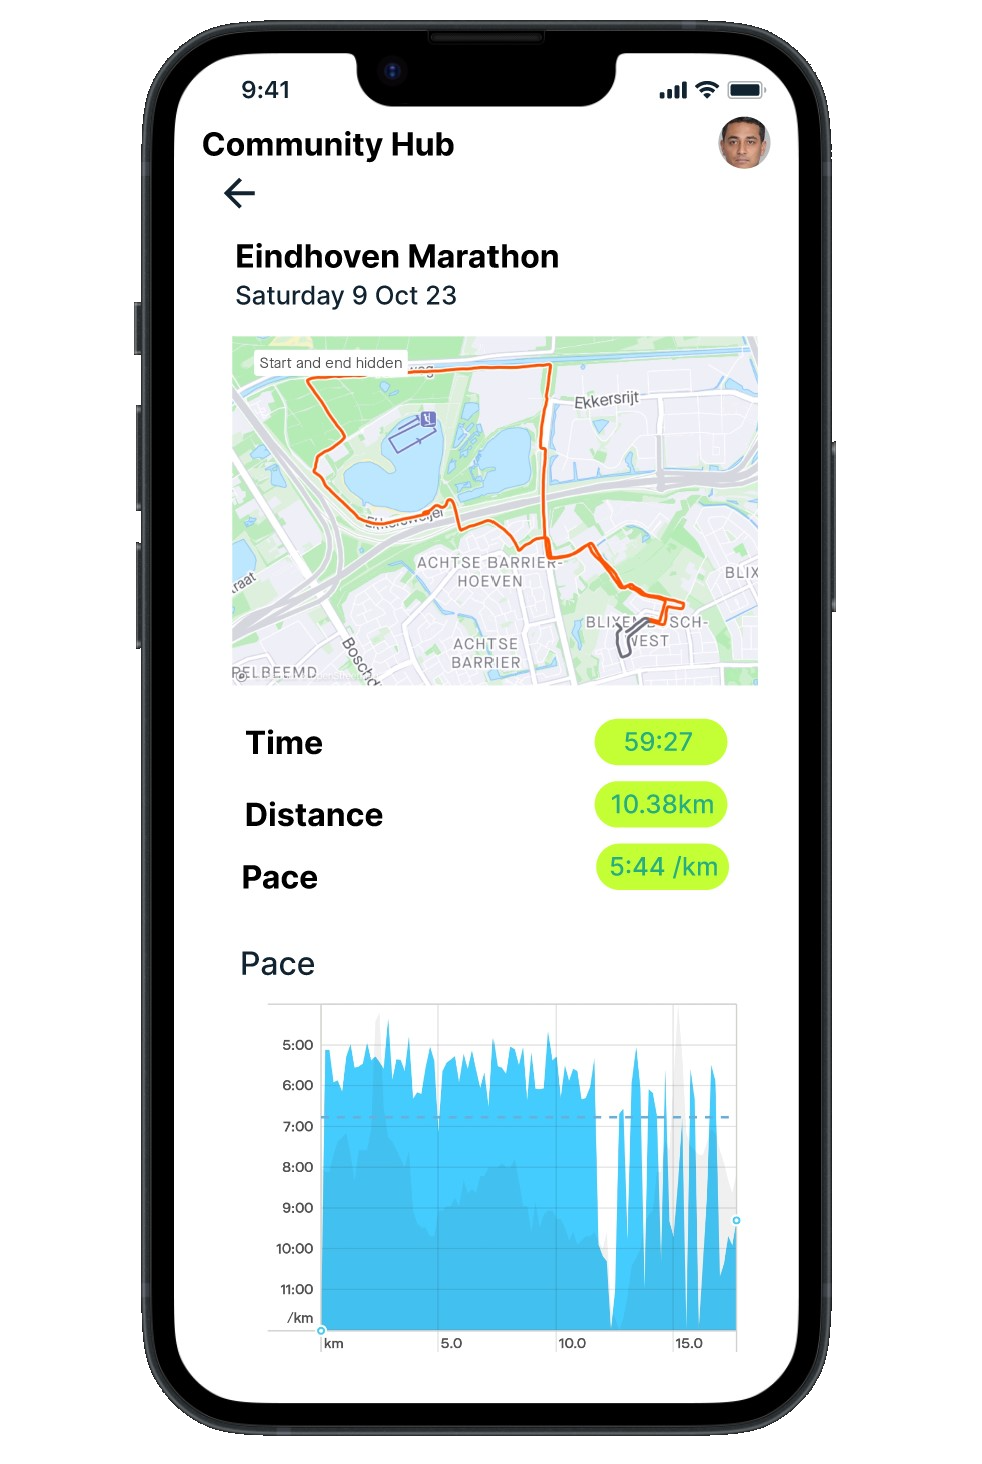
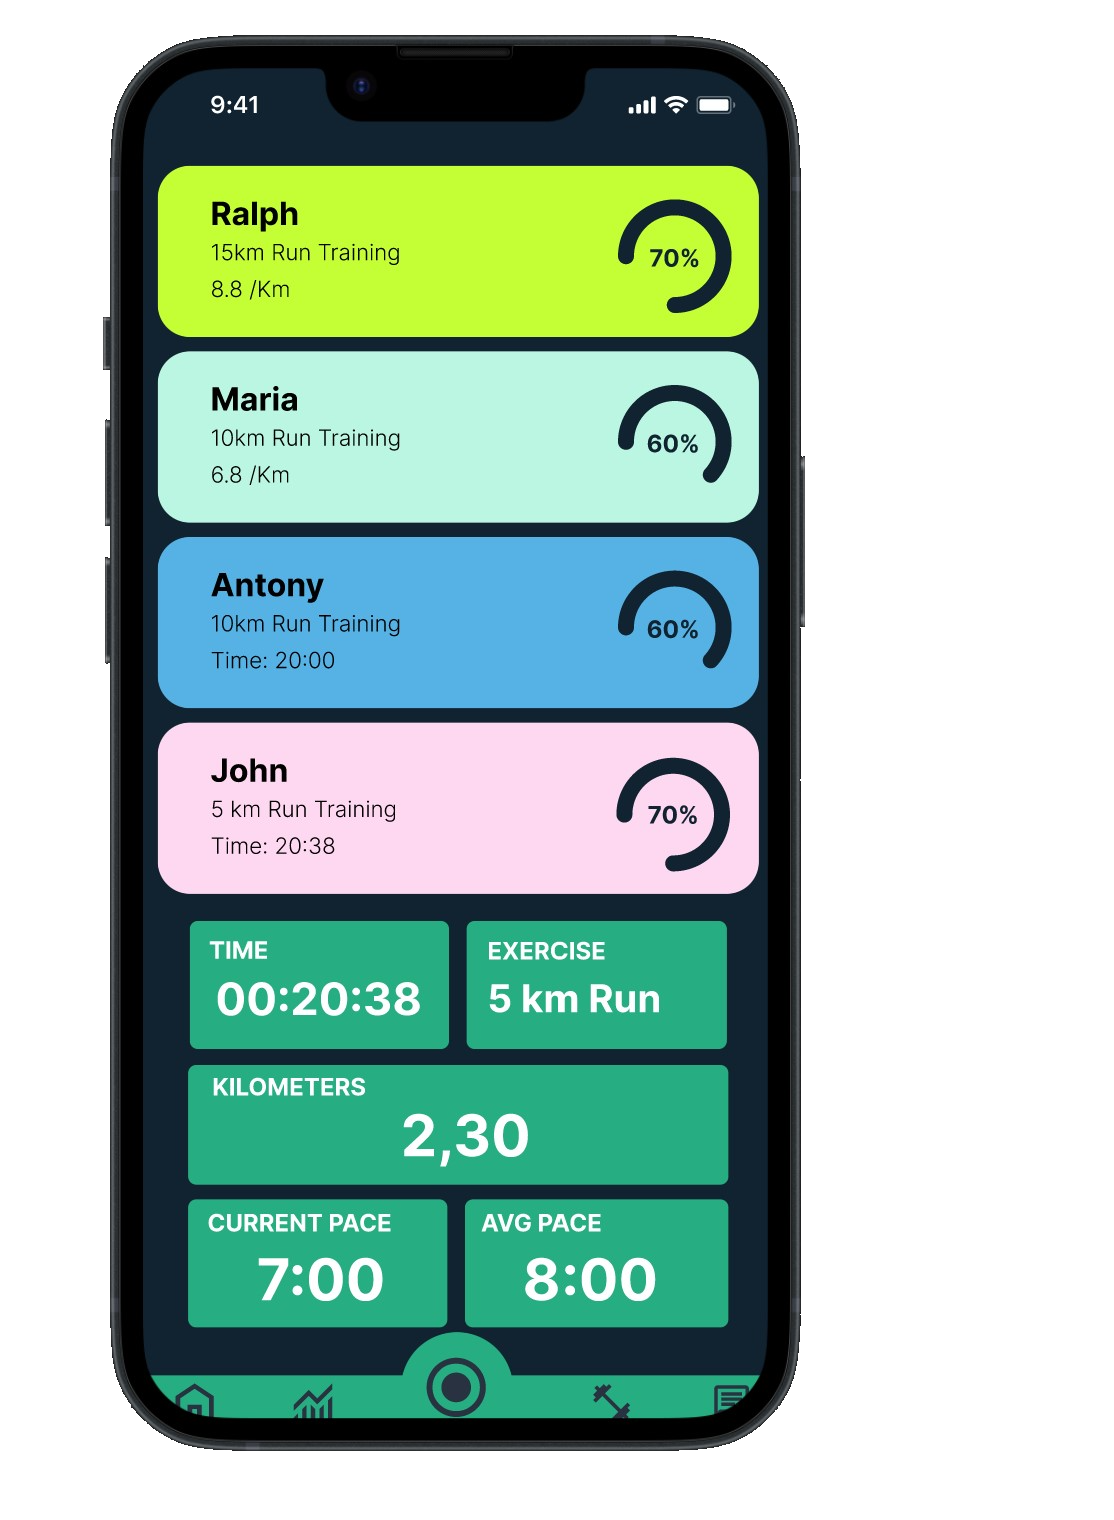
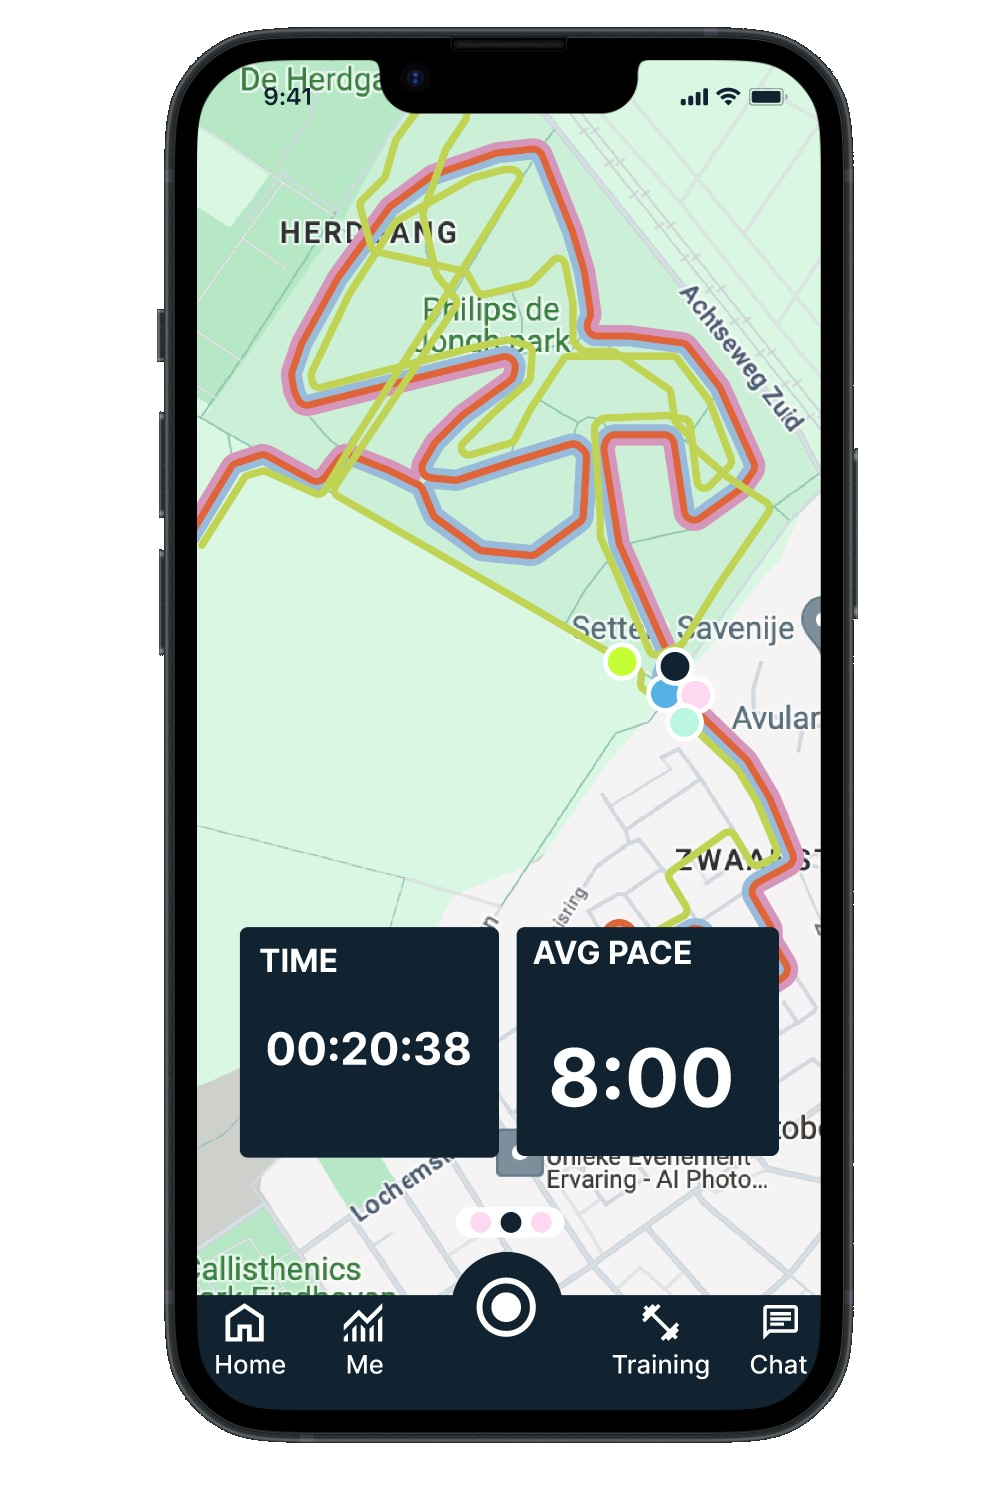
One distinctive characteristic of JAM RUN is its unique “JAM runs.” These allow the entire team to participiate in activities together, providing personalized training insights and the ability to observe the data of fellow team members. Throughout the run, teammates’ performances and progress can be monitored and tracked. Simultaneously, the app collects data from all participants to generate insights into the overall progress of the team, visible in the Community Hub through visualization graphs and rankings. 

JAM RUN is recognized for its innovative approach, requiring users to join as a team from the outset. This intentional design fosters a sense of teamwork, combining the essential elements of competition and the social aspect of running to motivate users collectively.